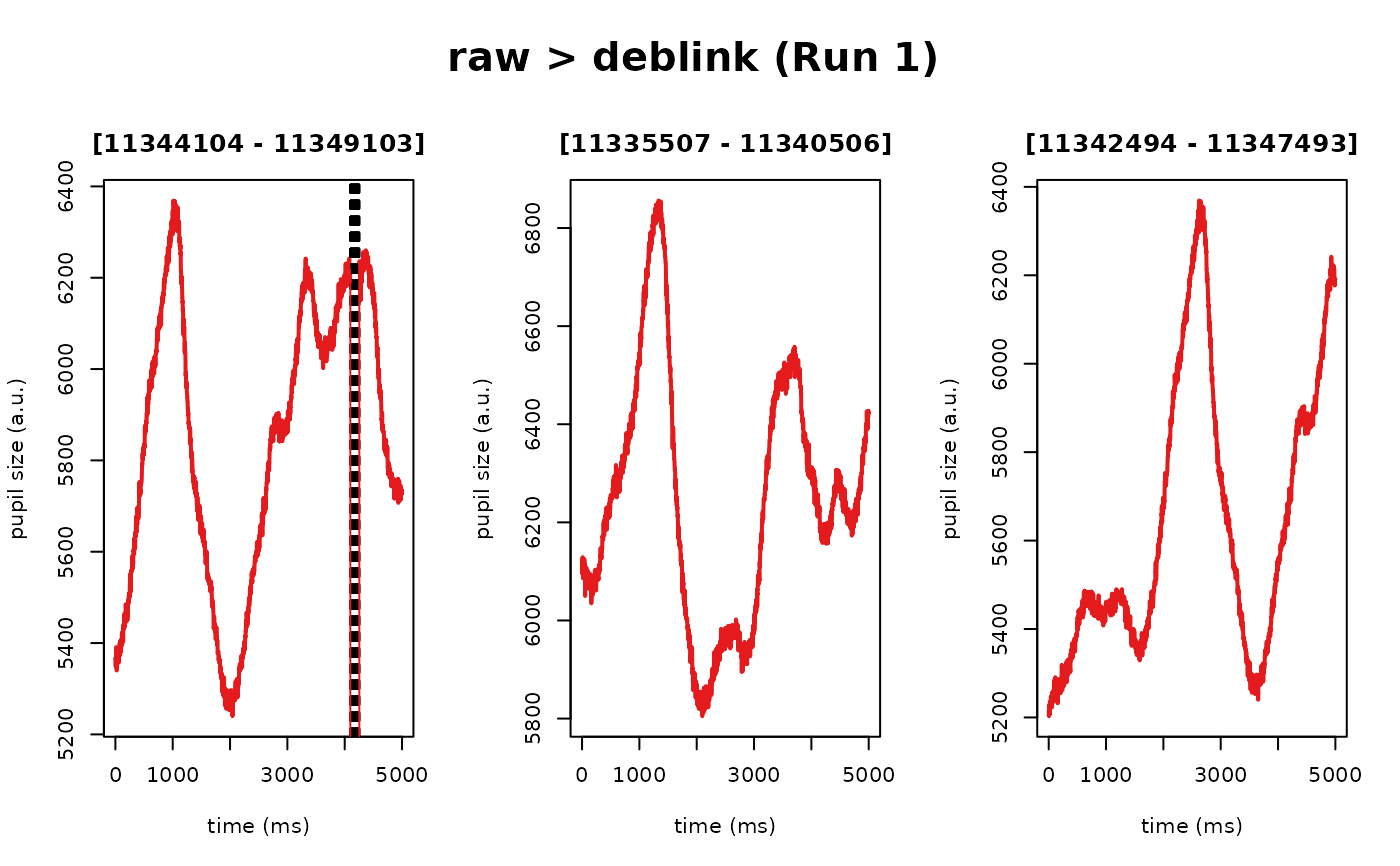
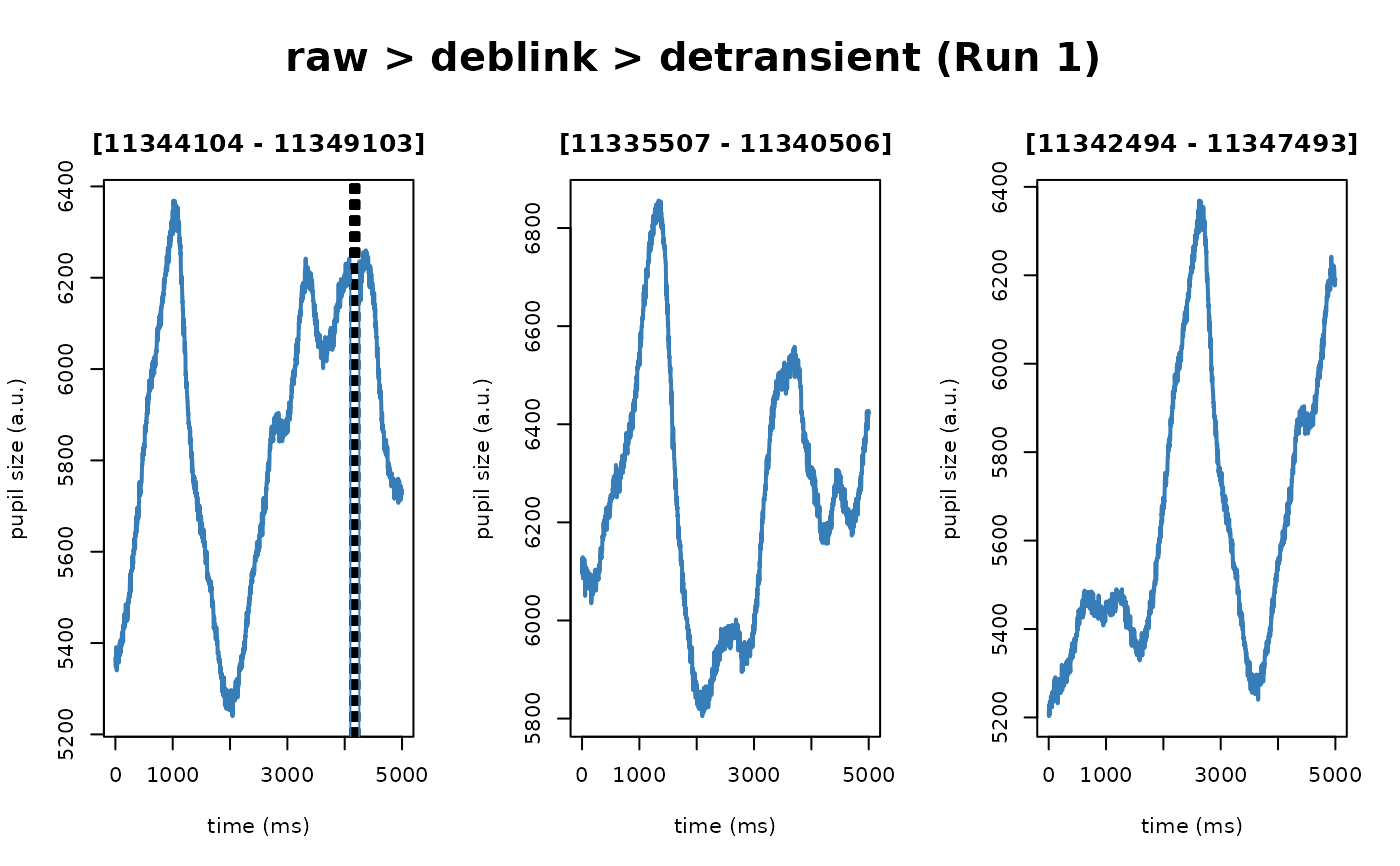
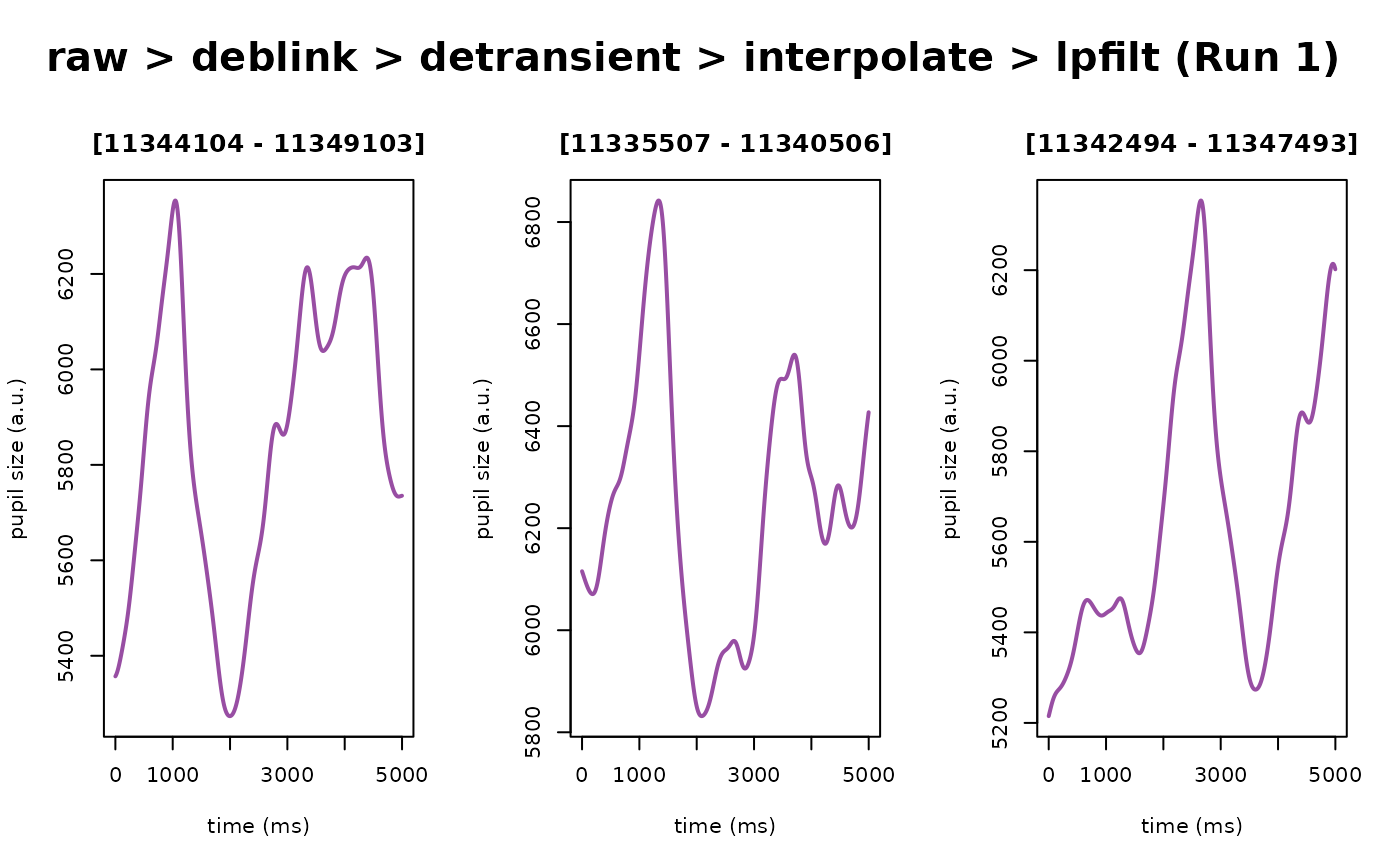
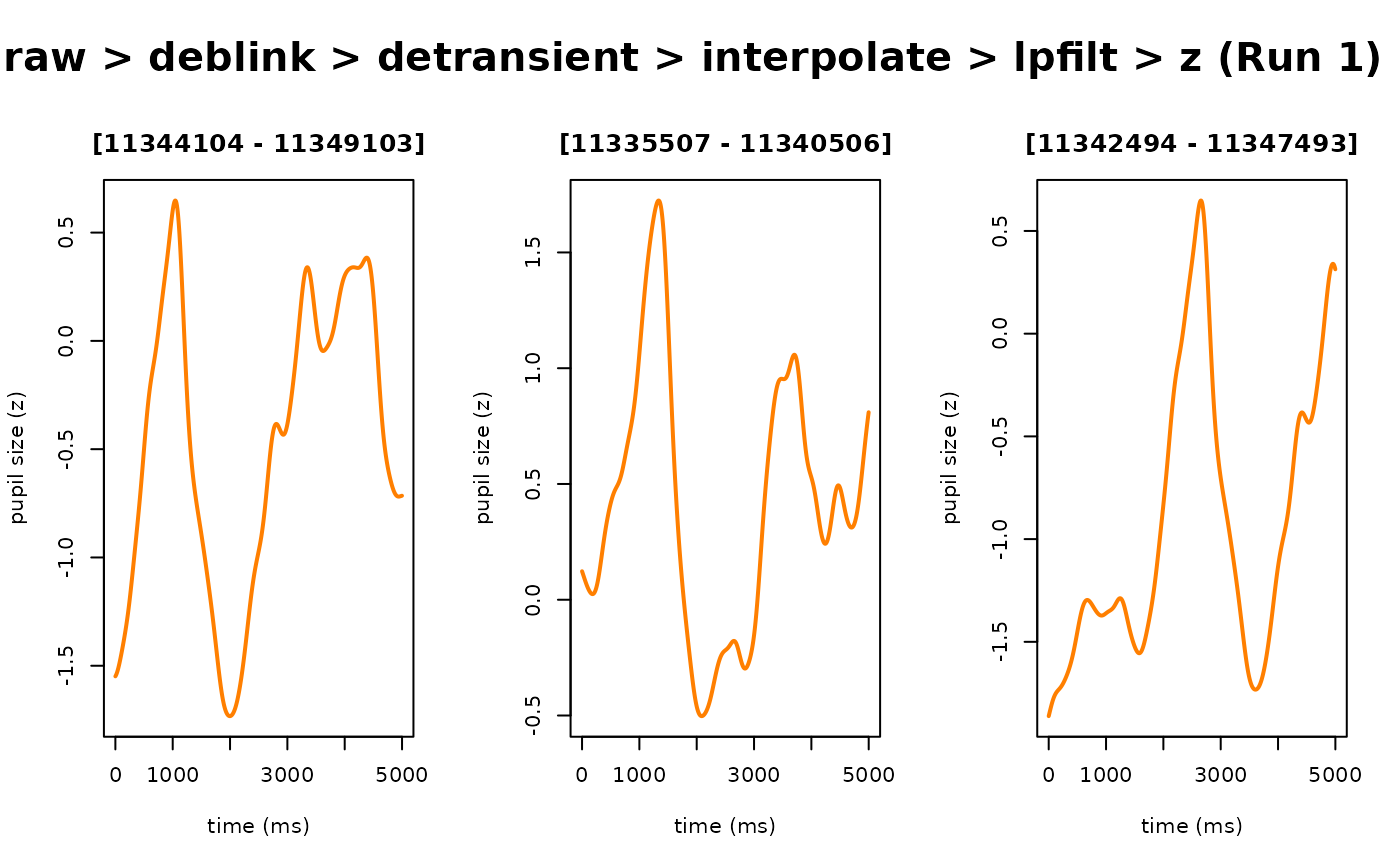
S3 plotting method for objects of class eyeris. Plots a single-panel
timeseries for a subset of the pupil time series at each preprocessing step.
The intended use of this function is to provide a simple method for
qualitatively assessing the consequences of the preprocessing recipe and
parameters on the raw pupillary signal.
Usage
# S3 method for class 'eyeris'
plot(
  x,
  ...,
  steps = NULL,
  preview_n = NULL,
  preview_duration = NULL,
  preview_window = NULL,
  seed = NULL,
  block = 1,
  plot_distributions = FALSE,
  suppress_prompt = TRUE,
  verbose = TRUE,
  add_progressive_summary = FALSE,
  eye = c("left", "right", "both"),
  num_previews = deprecated()
)
Arguments
- x
An object of class
eyerisderived fromload_asc()- ...
Additional arguments to be passed to
plot- steps
Which steps to plot; defaults to
all(i.e., plot all steps). Otherwise, pass in a vector containing the index of the step(s) you want to plot, with index1being the original raw pupil time series- preview_n
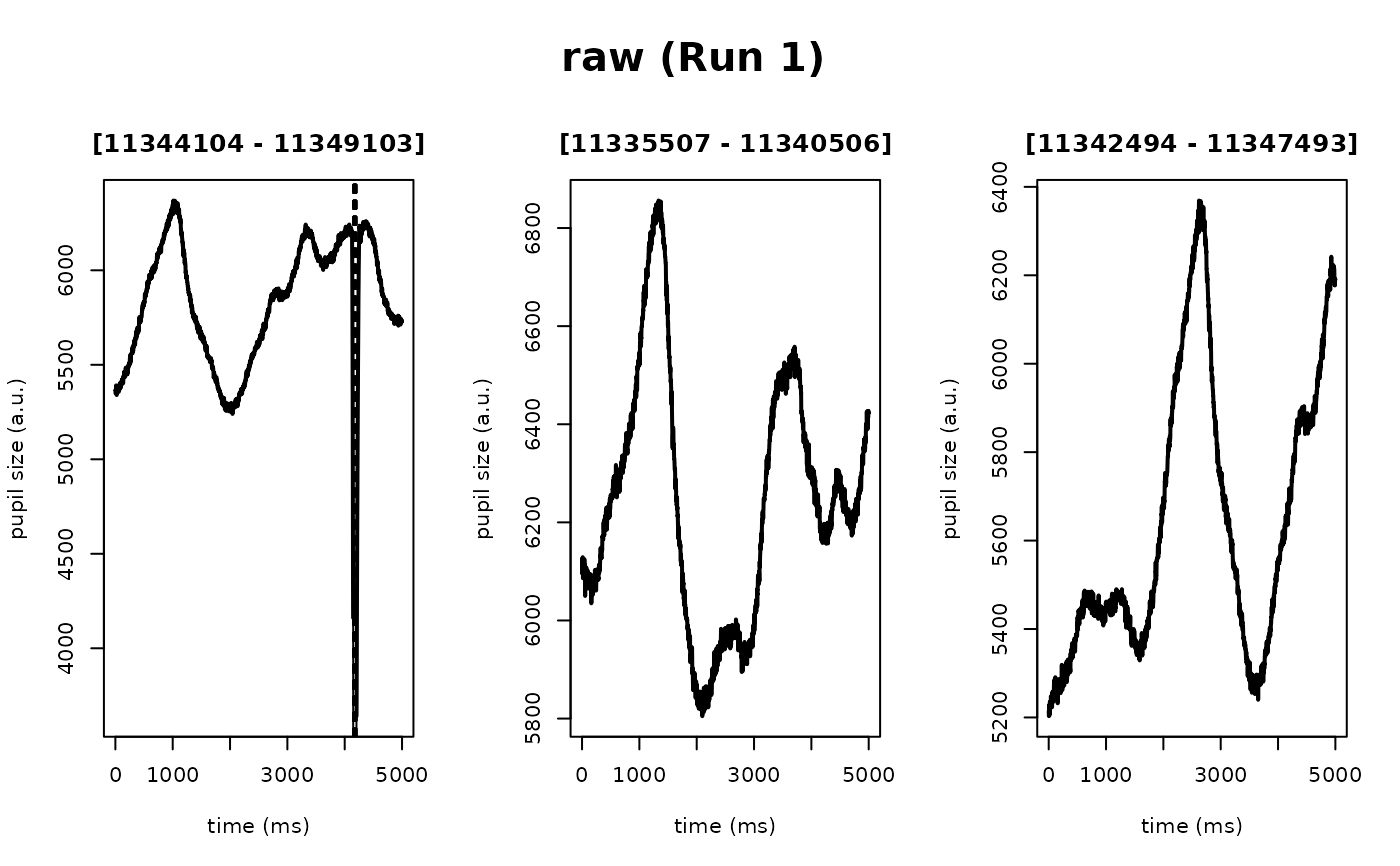
Number of random example "epochs" to generate for previewing the effect of each preprocessing step on the pupil time series
- preview_duration
Time in seconds of each randomly selected preview
- preview_window
The start and stop raw timestamps used to subset the preprocessed data from each step of the
eyerisworkflow for visualization Defaults to NULL, meaning random epochs as defined bypreview_nandpreview_durationwill be plotted. To override the random epochs, setpreview_windowhere to a vector with relative start and stop times (in seconds), for example –c(5,6)– to indicate the raw data from 5-6 secs on data that were recorded at 1000 Hz). Note, the start/stop time values indicated here are in seconds becauseeyerisautomatically computes the indices for the supplied range of seconds using the$info$sample.ratemetadata in theeyerisS3 class object- seed
Random seed for current plotting session. Leave NULL to select
preview_nnumber of random preview "epochs" (ofpreview_duration) each time. Otherwise, choose any seed-integer as you would normally select forbase::set.seed(), and you will be able to continue re-plotting the same random example pupil epochs each time – which is helpful when adjusting parameters within and acrosseyerisworkflow steps- block
For multi-block recordings, specifies which block to plot. Defaults to 1. When a single
.ascdata file contains multiple recording blocks, this parameter determines which block's time series to visualize. Must be a positive integer not exceeding the total number of blocks in the recording- plot_distributions
Logical flag to indicate whether to plot both diagnostic pupil time series and accompanying histograms of the pupil samples at each processing step. Defaults to
FALSE- suppress_prompt
Logical flag to disable interactive confirmation prompts during plotting. Defaults to
TRUE, which avoids hanging behavior in non-interactive or automated contexts (e.g., RMarkdown, scripts) Set toFALSEonly when running insideglassbox()withinteractive_preview = TRUE, where prompting after each step is desired, as well as in the generation of interactive HTML reports with bidsify- verbose
A logical flag to indicate whether to print status messages to the console. Defaults to
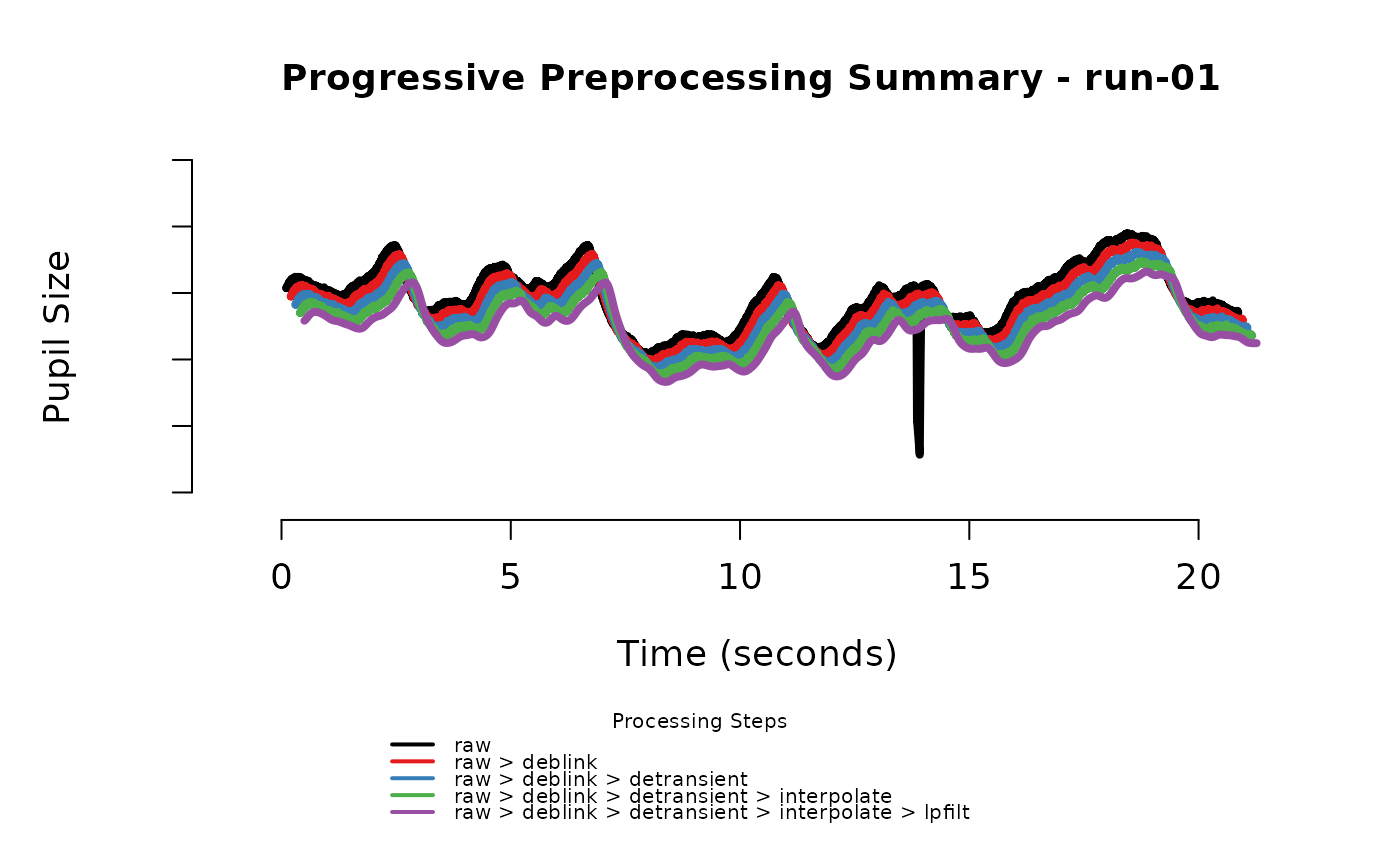
TRUE. Set toFALSEto suppress messages about the current processing step and run silently- add_progressive_summary
Logical flag to indicate whether to add a progressive summary plot after plotting. Defaults to
FALSE. Set toTRUEto enable the progressive summary plot (useful for interactive exploration). Set toFALSEto disable the progressive summary plot (useful in automated contexts like bidsify reports)- eye
For binocular data, specifies which eye to plot: "left", "right", or "both". Defaults to "left". For "both", currently plots left eye data (use eye="right" for right eye data)
- num_previews
(Deprecated) Use
preview_ninstead
Value
No return value; iteratively plots a subset of the pupil time series from each preprocessing step run
Examples
# first, generate the preprocessed pupil data
my_eyeris_data <- system.file("extdata", "memory.asc", package = "eyeris") |>
eyeris::load_asc() |>
eyeris::deblink(extend = 50) |>
eyeris::detransient() |>
eyeris::interpolate() |>
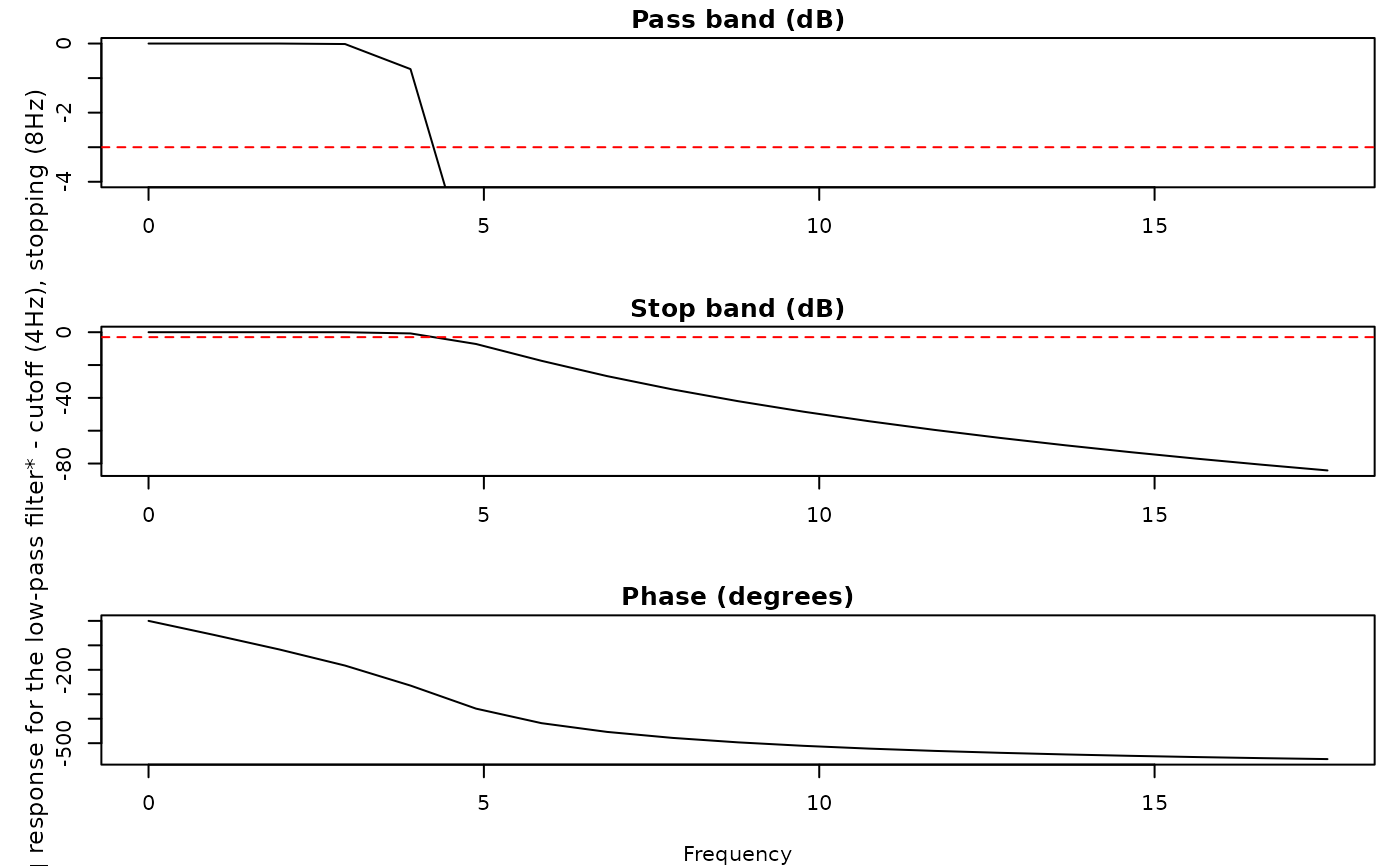
eyeris::lpfilt(plot_freqz = TRUE) |>
eyeris::zscore()
 # controlling the time series range (i.e., preview window) in your plots:
## example 1: using the default 10000 to 20000 ms time subset
plot(my_eyeris_data, seed = 0, add_progressive_summary = TRUE)
#> ℹ [2026-06-19 07:38:25] [INFO] Plotting block 1 with sampling rate 1000 Hz from
#> possible blocks: 1
# controlling the time series range (i.e., preview window) in your plots:
## example 1: using the default 10000 to 20000 ms time subset
plot(my_eyeris_data, seed = 0, add_progressive_summary = TRUE)
#> ℹ [2026-06-19 07:38:25] [INFO] Plotting block 1 with sampling rate 1000 Hz from
#> possible blocks: 1


 #> ℹ [2026-06-19 07:38:25] [INFO] Creating progressive summary plot for block_1
 #> ✔ [2026-06-19 07:38:25] [OKAY] Progressive summary plot created successfully!
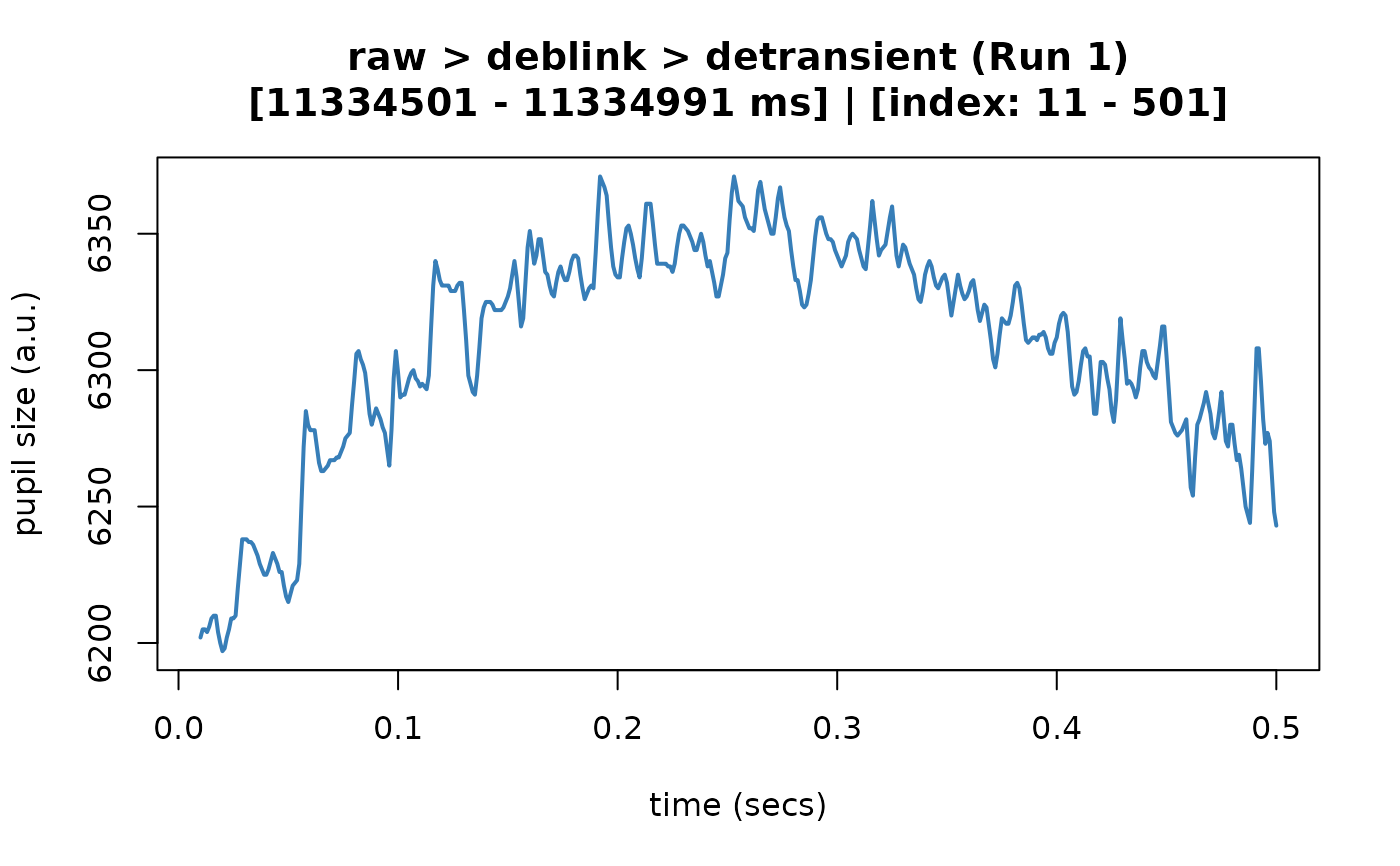
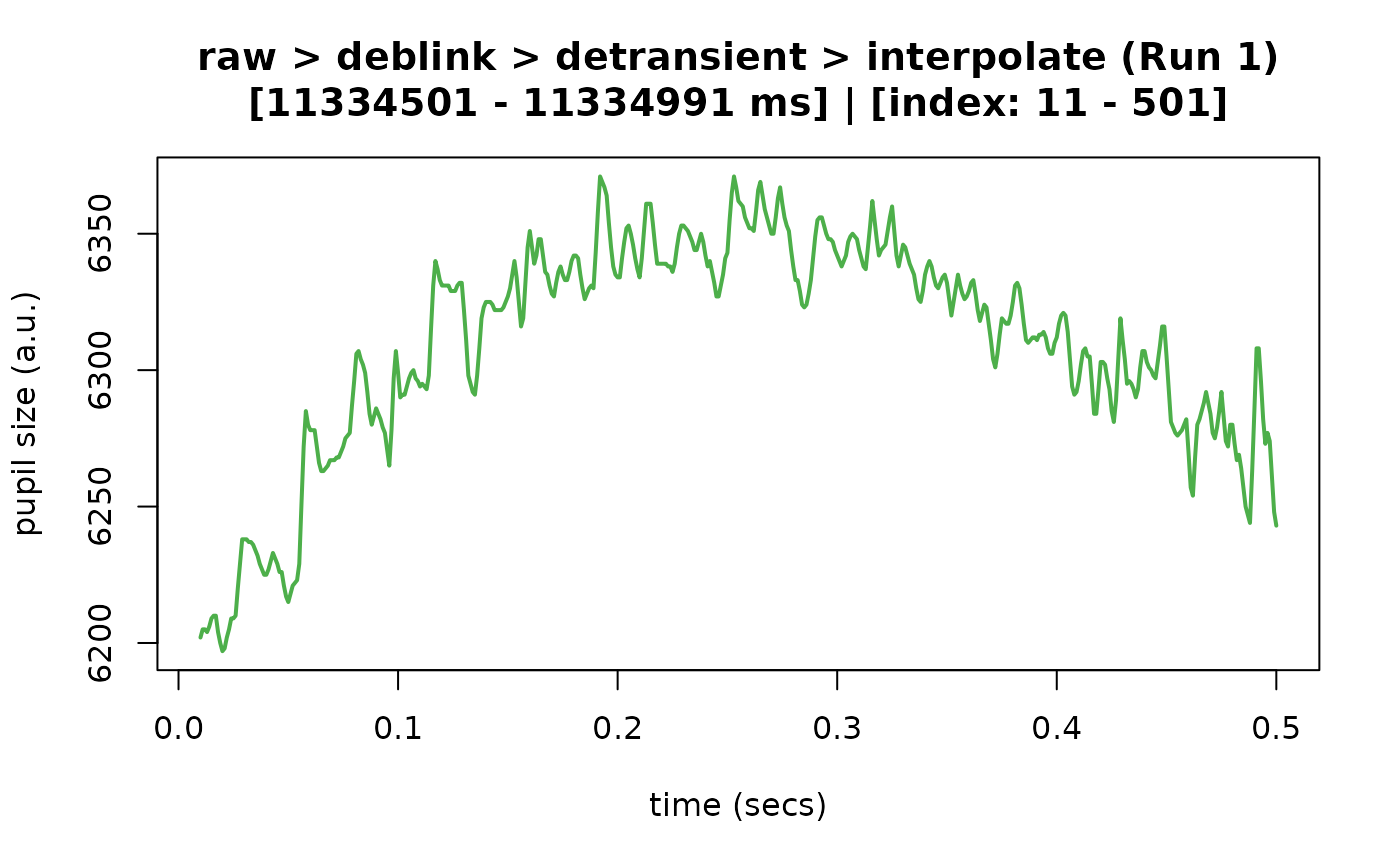
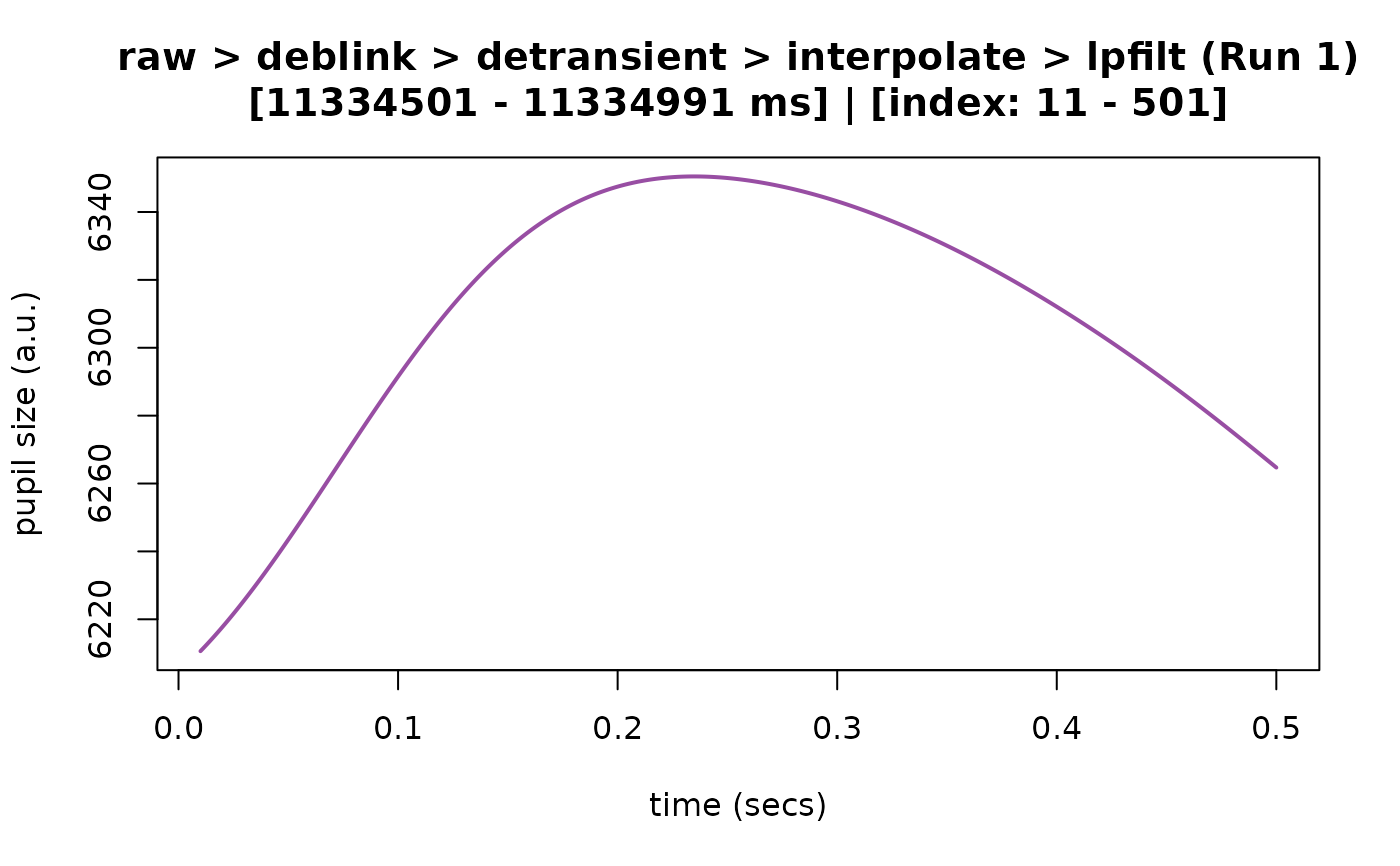
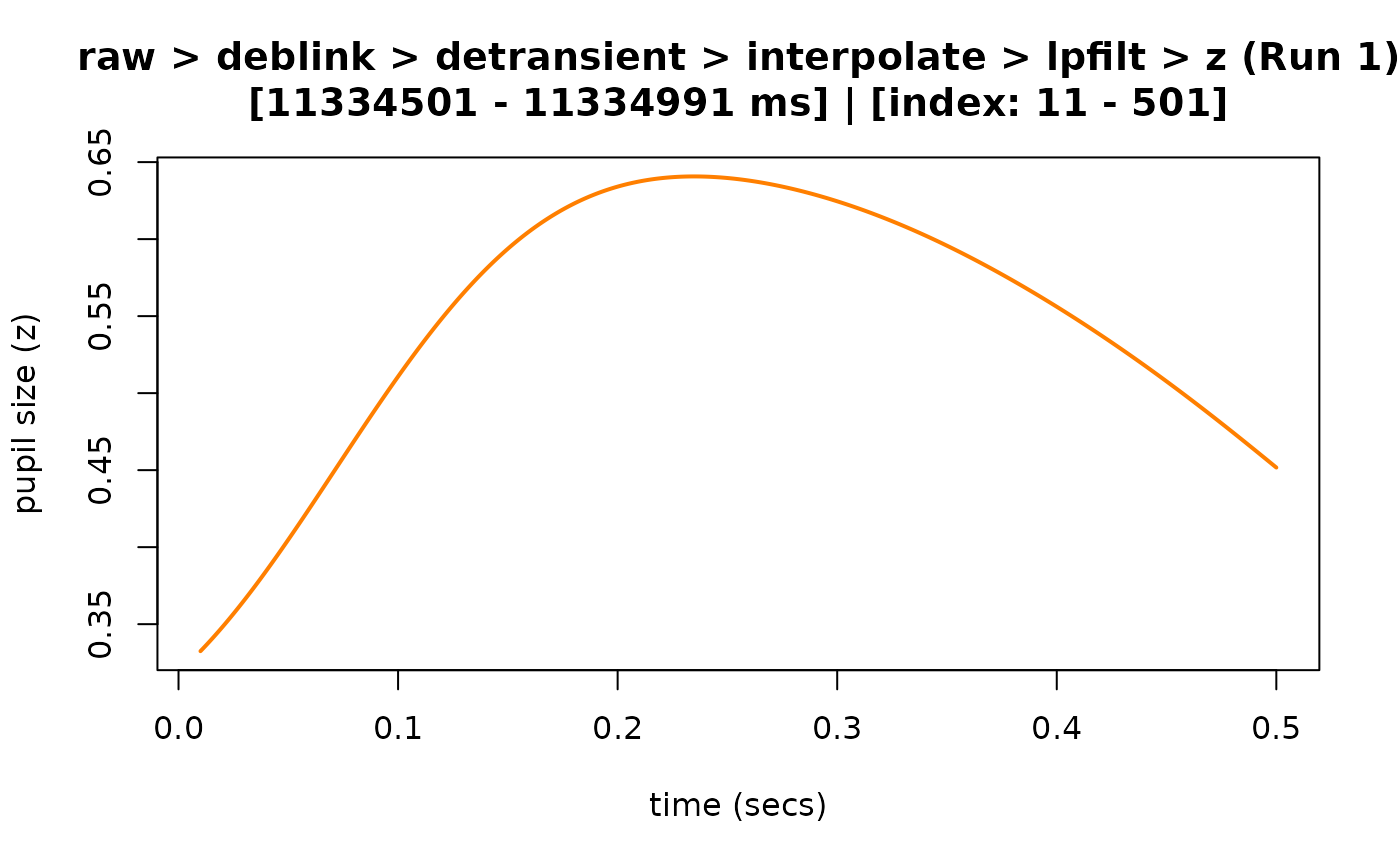
## example 2: using a custom time subset (i.e., 1 to 500 ms)
plot(
my_eyeris_data,
preview_window = c(0.01, 0.5),
seed = 0,
add_progressive_summary = TRUE
)
#> ℹ [2026-06-19 07:38:25] [INFO] Plotting block 1 with sampling rate 1000 Hz from
#> possible blocks: 1
#> ✔ [2026-06-19 07:38:25] [OKAY] Progressive summary plot created successfully!
## example 2: using a custom time subset (i.e., 1 to 500 ms)
plot(
my_eyeris_data,
preview_window = c(0.01, 0.5),
seed = 0,
add_progressive_summary = TRUE
)
#> ℹ [2026-06-19 07:38:25] [INFO] Plotting block 1 with sampling rate 1000 Hz from
#> possible blocks: 1
 #> ℹ [2026-06-19 07:38:25] [INFO] Creating progressive summary plot for block_1
 #> ✔ [2026-06-19 07:38:25] [OKAY] Progressive summary plot created successfully!
# controlling which block of data you would like to plot:
## example 1: plots first block (default)
plot(my_eyeris_data, seed = 0)
#> ℹ [2026-06-19 07:38:26] [INFO] Plotting block 1 with sampling rate 1000 Hz from
#> possible blocks: 1
#> ✔ [2026-06-19 07:38:25] [OKAY] Progressive summary plot created successfully!
# controlling which block of data you would like to plot:
## example 1: plots first block (default)
plot(my_eyeris_data, seed = 0)
#> ℹ [2026-06-19 07:38:26] [INFO] Plotting block 1 with sampling rate 1000 Hz from
#> possible blocks: 1


 ## example 2: plots a specific block
plot(my_eyeris_data, block = 1, seed = 0)
#> ℹ [2026-06-19 07:38:26] [INFO] Plotting block 1 with sampling rate 1000 Hz from
#> possible blocks: 1
## example 2: plots a specific block
plot(my_eyeris_data, block = 1, seed = 0)
#> ℹ [2026-06-19 07:38:26] [INFO] Plotting block 1 with sampling rate 1000 Hz from
#> possible blocks: 1


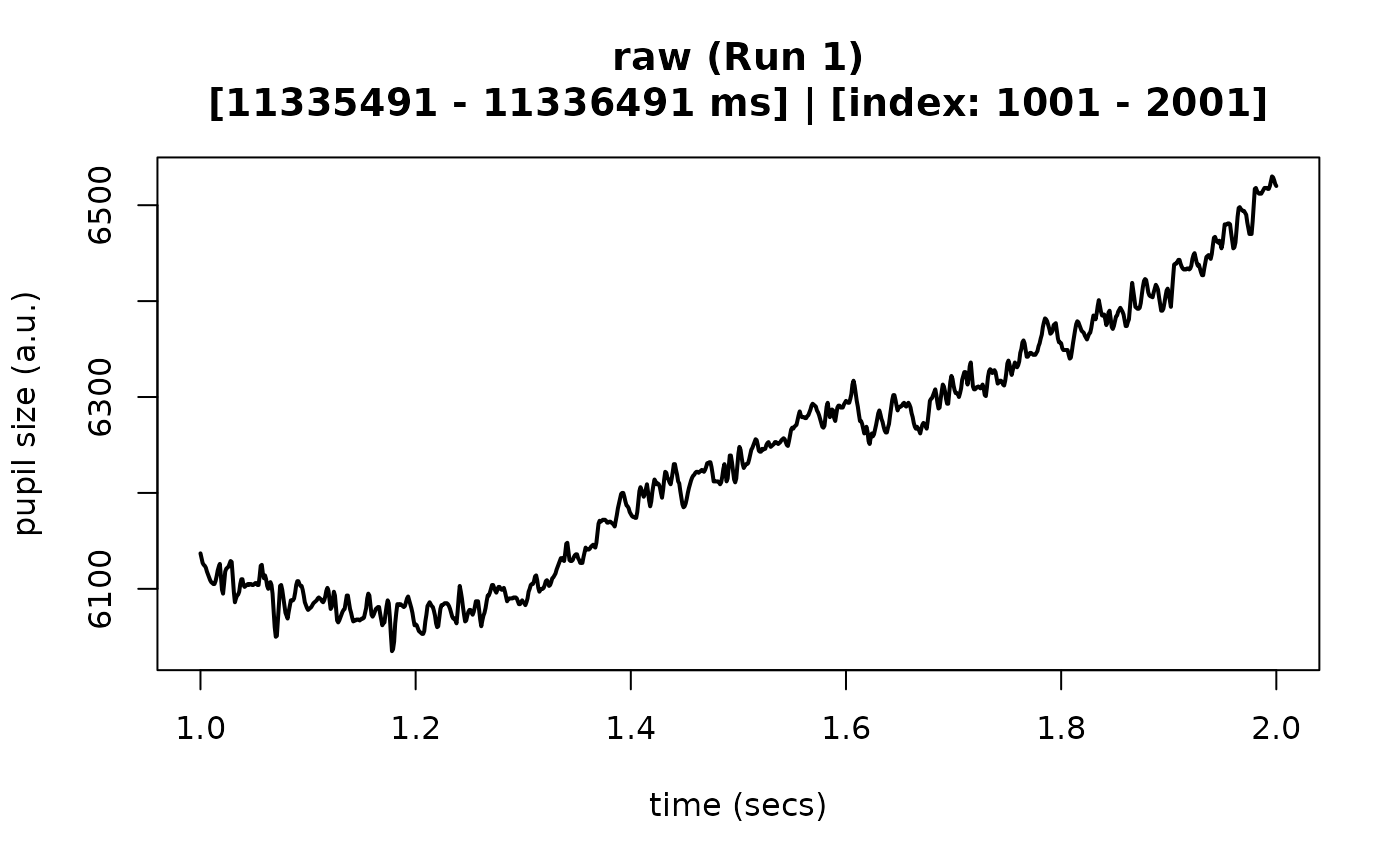
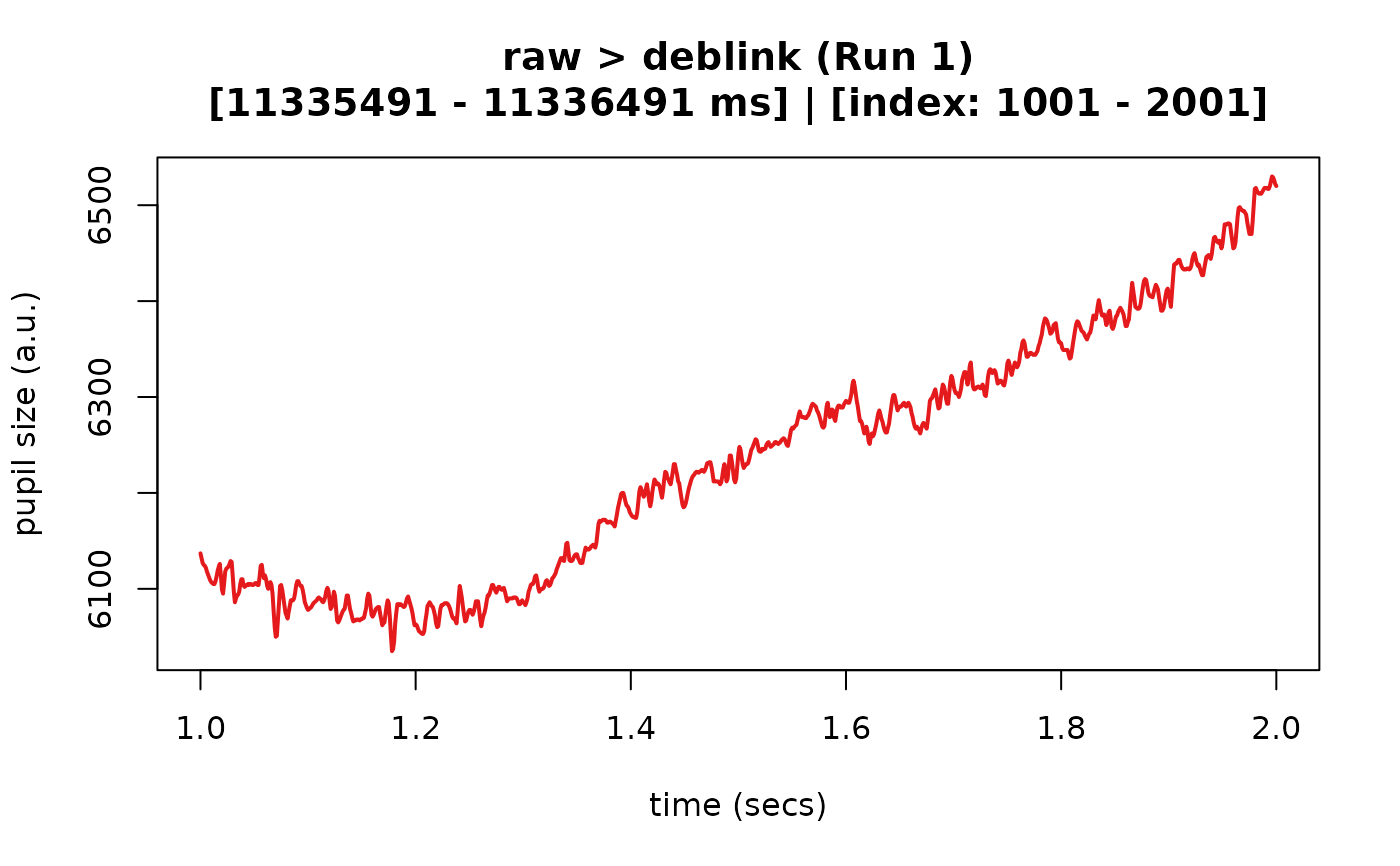
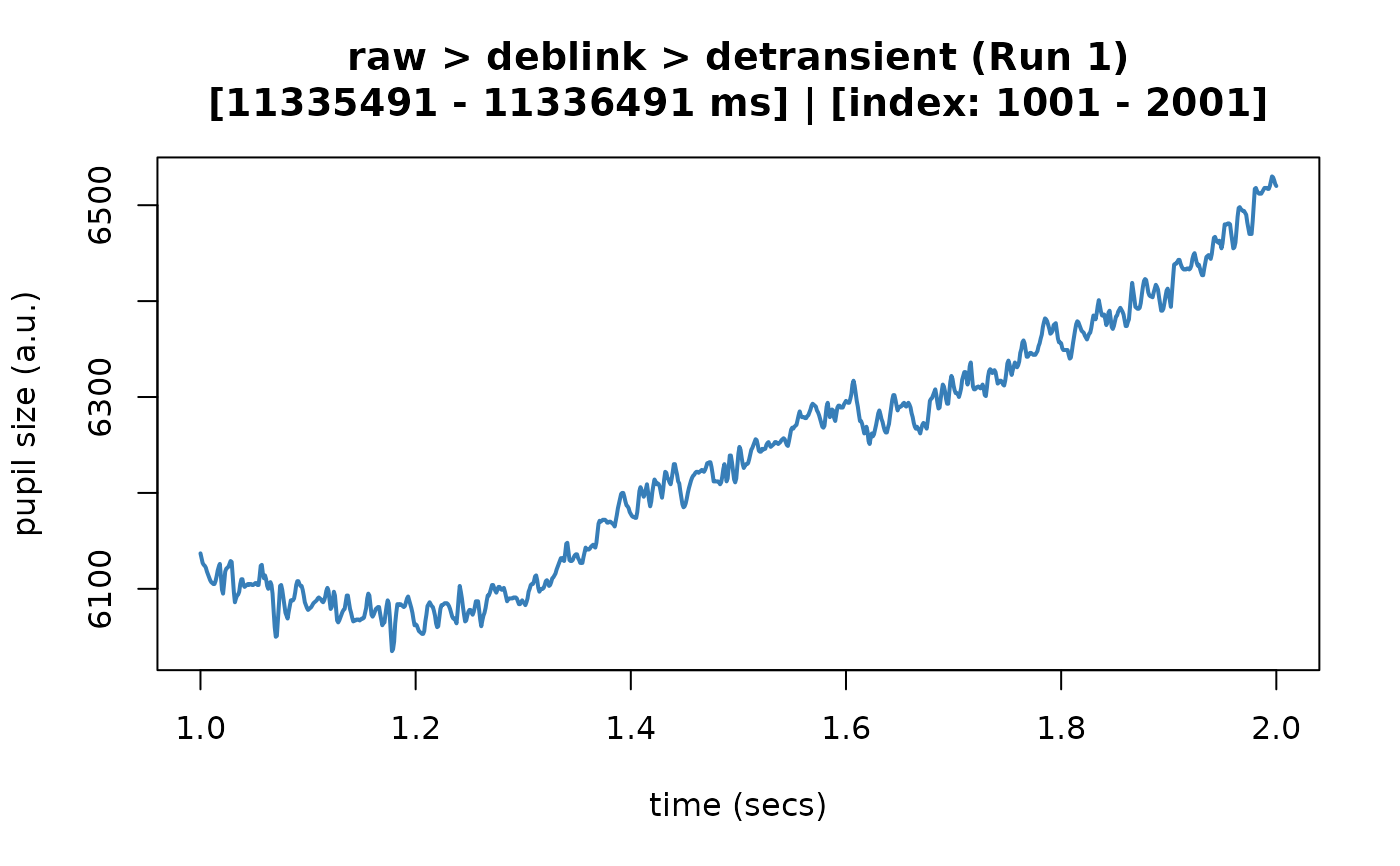
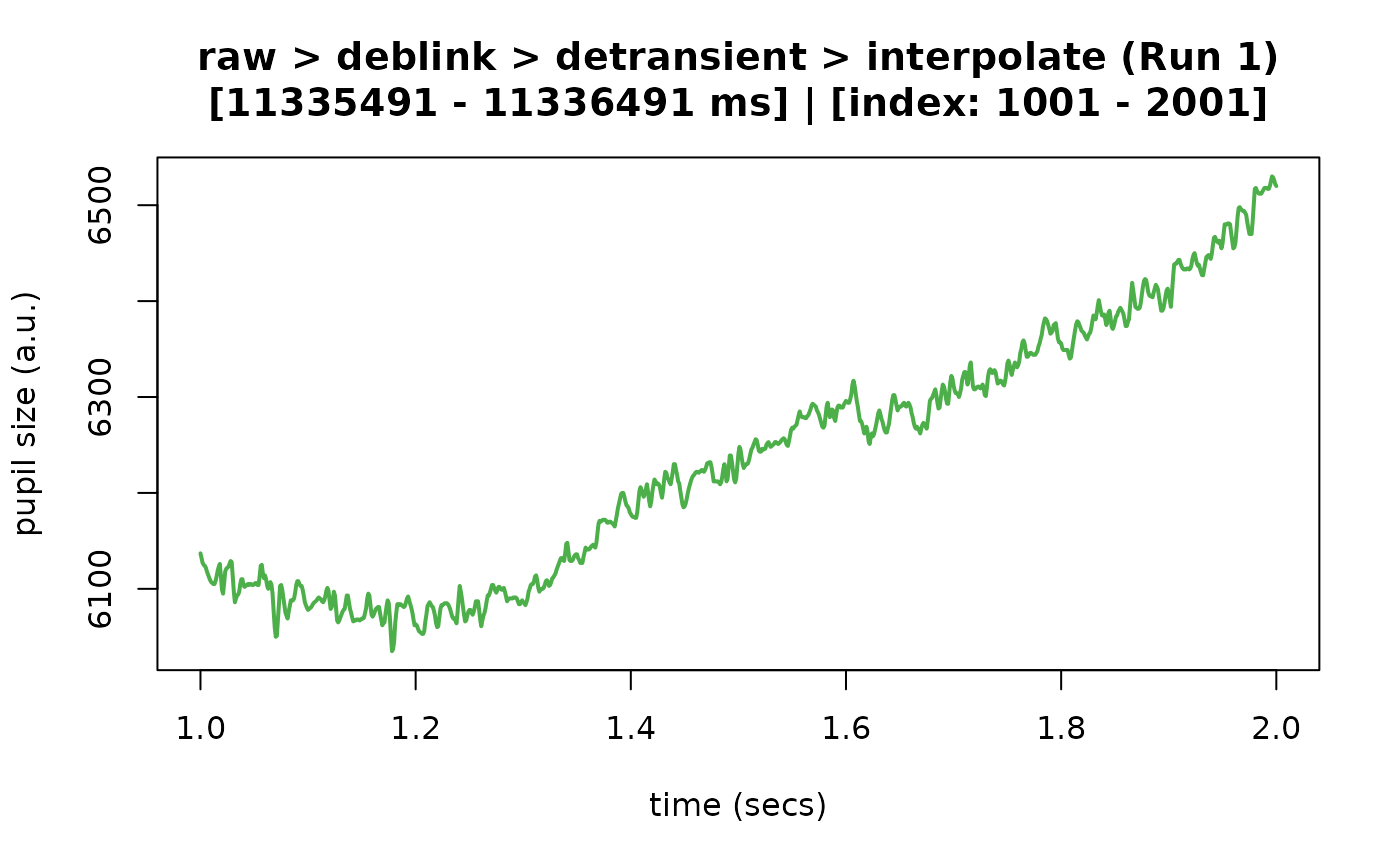
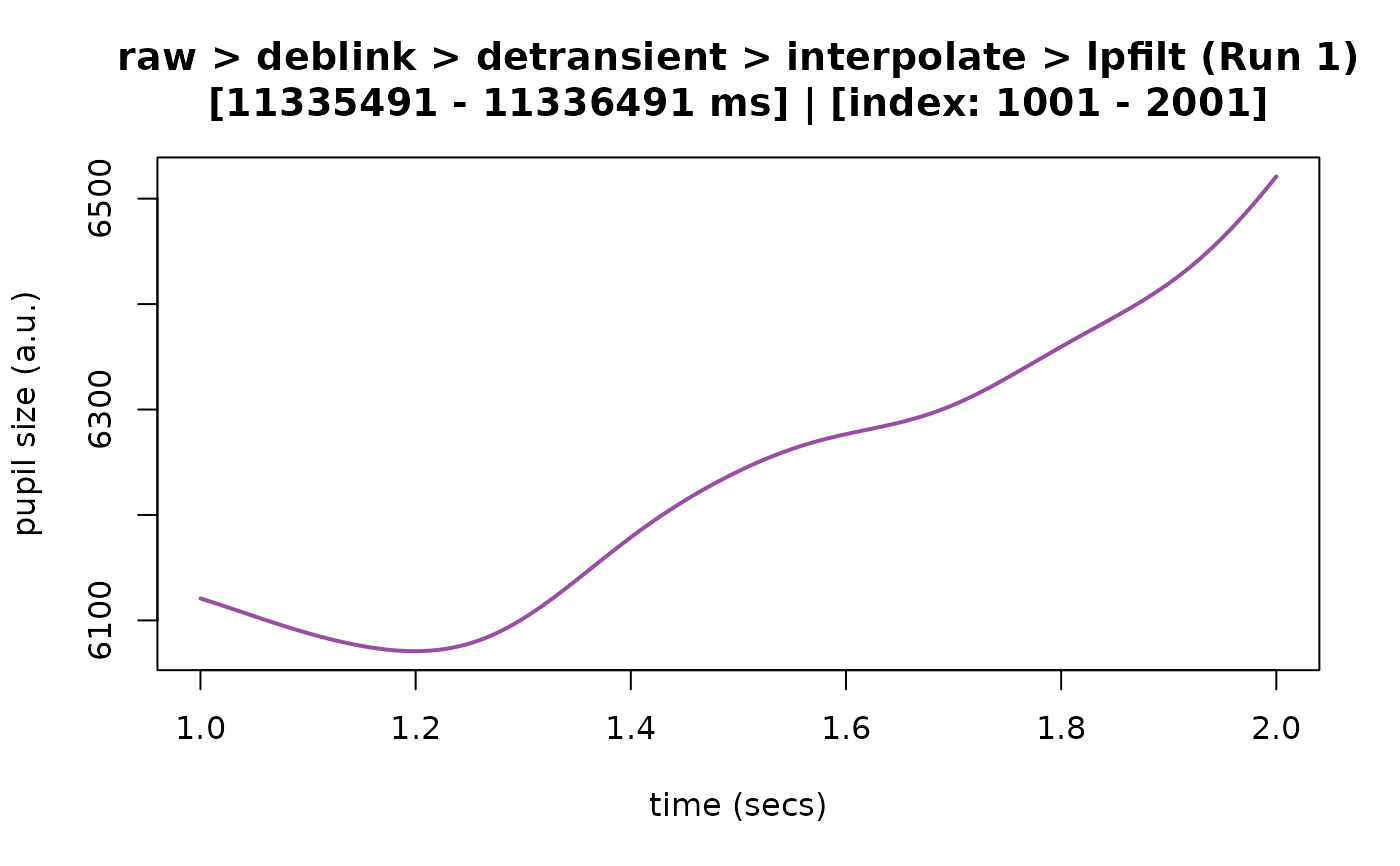
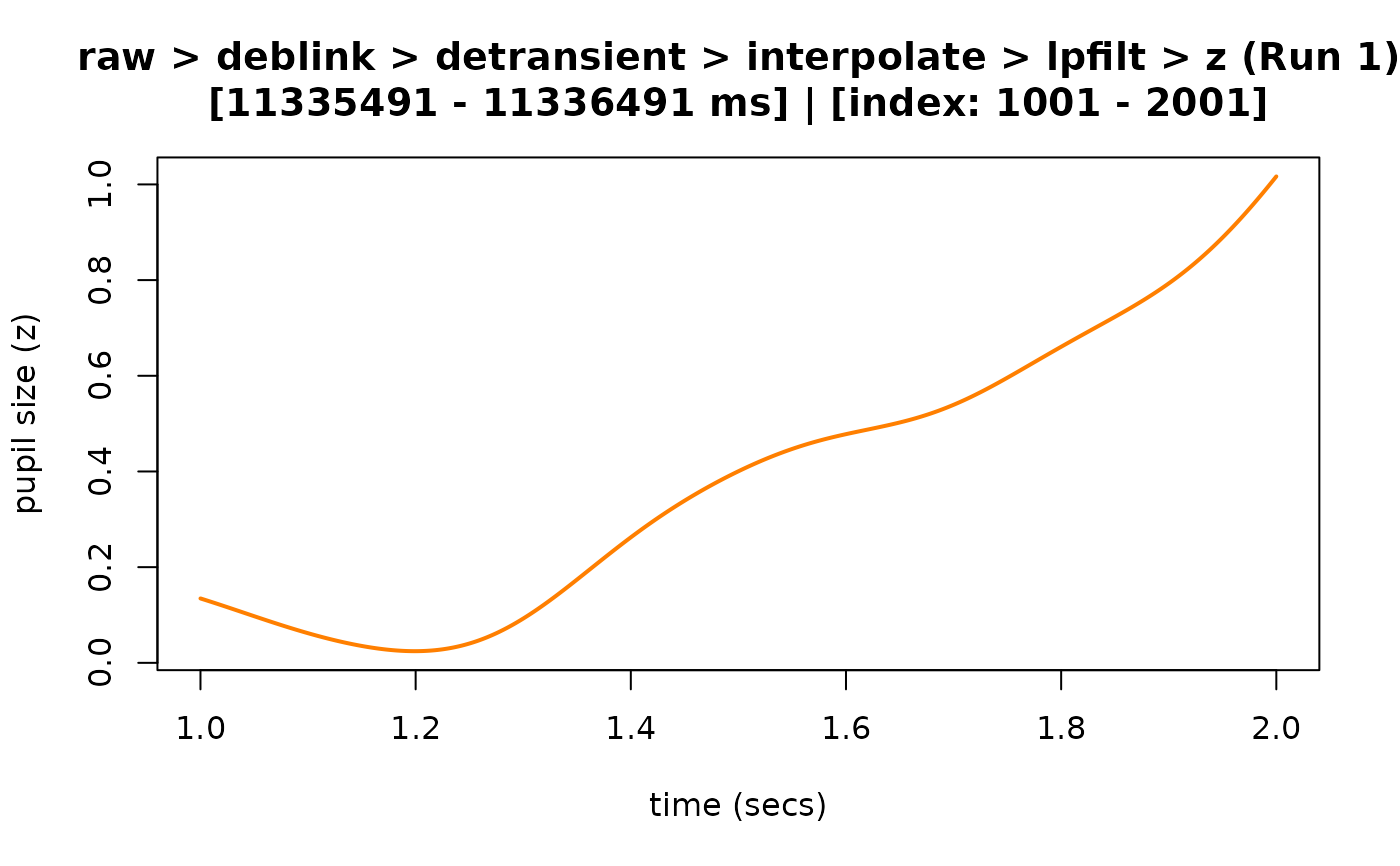
 ## example 3: plots a specific block along with a custom preview window
## (i.e., 1000 to 2000 ms)
plot(
my_eyeris_data,
block = 1,
preview_window = c(1, 2),
seed = 0
)
#> ℹ [2026-06-19 07:38:26] [INFO] Plotting block 1 with sampling rate 1000 Hz from
#> possible blocks: 1
## example 3: plots a specific block along with a custom preview window
## (i.e., 1000 to 2000 ms)
plot(
my_eyeris_data,
block = 1,
preview_window = c(1, 2),
seed = 0
)
#> ℹ [2026-06-19 07:38:26] [INFO] Plotting block 1 with sampling rate 1000 Hz from
#> possible blocks: 1