Plot binocular correlation between left and right eye data
Source:R/plot.eyeris.R
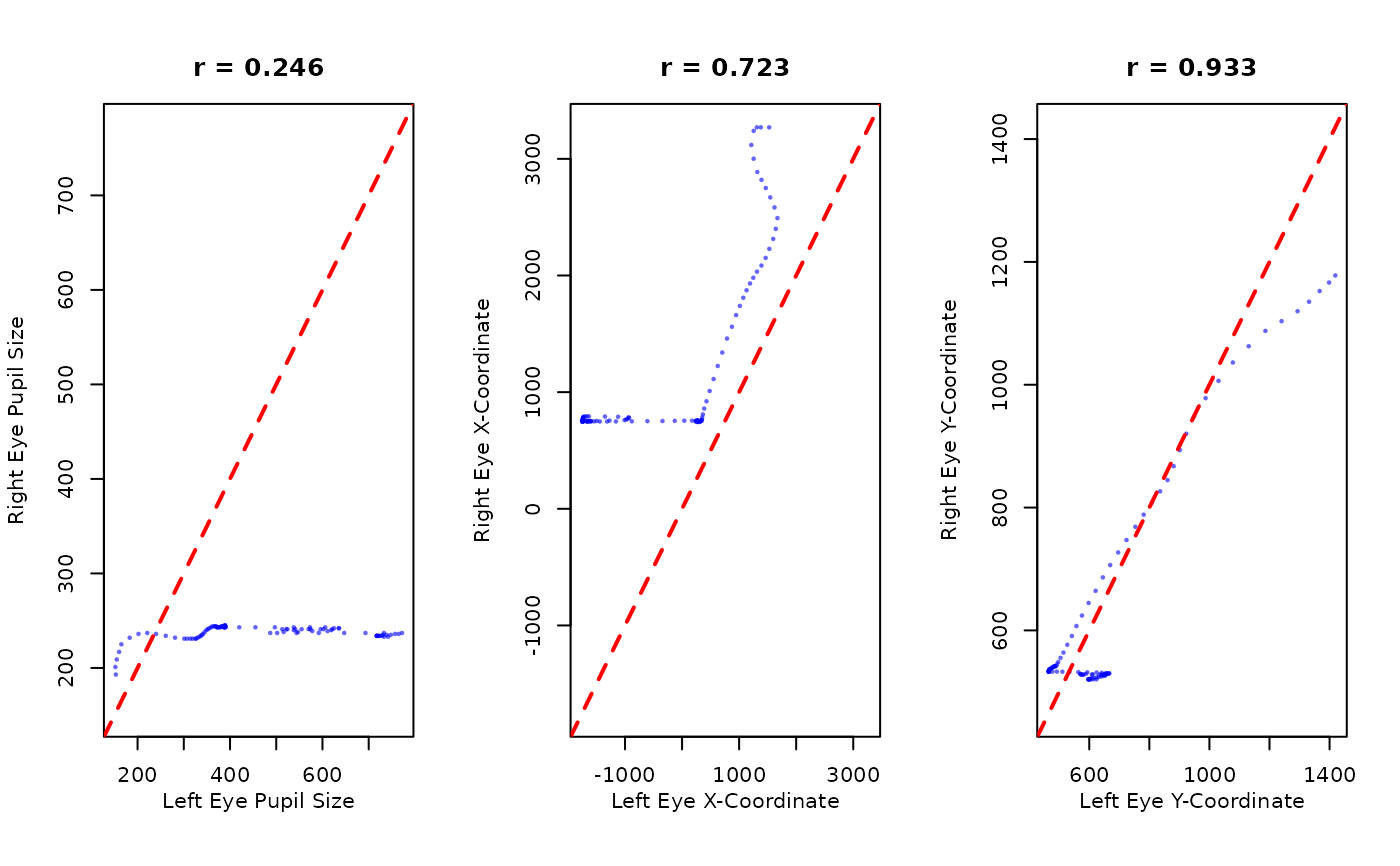
plot_binocular_correlation.RdCreates correlation plots showing the relationship between left and right eye measurements for pupil size, x-coordinates, and y-coordinates. This function is useful for validating binocular data quality and assessing the correlation between the two eyes.
Usage
plot_binocular_correlation(
  eyeris,
  block = 1,
  variables = c("pupil", "x", "y"),
  main = "",
  col_palette = "viridis",
  sample_rate = NULL,
  verbose = TRUE
)
Arguments
- eyeris
An object of class
eyerisderived fromload_asc()with binocular data, or a list containingleftandrighteyeris objects (frombinocular_mode = "both")- block
Block number to plot (default: 1)
- variables
Variables to plot correlations for. Defaults to
c("pupil", "x", "y")for pupil size, x-coordinates, and y-coordinates- main
Title for the overall plot (default: "Binocular Correlation")
- col_palette
Color palette for the plots (default: "viridis")
- sample_rate
Sample rate in Hz (optional, for time-based sampling)
- verbose
Logical flag to indicate whether to print status messages (default: TRUE)
Examples
# For binocular data loaded with binocular_mode = "both"
binocular_data <- load_asc(eyelink_asc_binocular_demo_dataset(), binocular_mode = "both")
#> ℹ [2026-06-19 07:38:28] [INFO] Binocular data detected. Processing both mode.
plot_binocular_correlation(binocular_data)

#> ✔ [2026-06-19 07:38:28] [OKAY] Created binocular correlation plots for block 1

# For binocular data loaded with binocular_mode = "average"
# (correlation plot will show original left vs right before averaging)
avg_data <- load_asc(eyelink_asc_binocular_demo_dataset(), binocular_mode = "average")
#> ℹ [2026-06-19 07:38:28] [INFO] Binocular data detected. Processing average
#> mode.
plot_binocular_correlation(avg_data$raw_binocular_object)
#> ✔ [2026-06-19 07:38:28] [OKAY] Created binocular correlation plots for block 1
#> ✔ [2026-06-19 07:38:28] [OKAY] Created binocular correlation plots for block 1
# For binocular data loaded with binocular_mode = "average"
# (correlation plot will show original left vs right before averaging)
avg_data <- load_asc(eyelink_asc_binocular_demo_dataset(), binocular_mode = "average")
#> ℹ [2026-06-19 07:38:28] [INFO] Binocular data detected. Processing average
#> mode.
plot_binocular_correlation(avg_data$raw_binocular_object)
#> ✔ [2026-06-19 07:38:28] [OKAY] Created binocular correlation plots for block 1